Overview
The grid clusterer uses the Google maps API to manage a large number of "data points", and displays the data points in grid-like "clusters".
Use the following links to learn about the grid clusterer:
- Creating data points vs creating Google map markers
- Tiles and grid points
- Clusterer configuration options and performance
- Enabling and disabling cluster marker click checks
- Clusterer Reference
Data Points
The grid clusterer accepts "data point" objects as input. A data point object has the following properties:
{
   key: number | string,   // The data point key (any unique number or string)
   lat: number,            // The data point latitude
   lon: number             // The data point longitude
}
An example of a data point with a numeric key is shown below:
data_pt = { key: 7133, lat: 37.4220698, lon: -122.086278 };
An example of a data point with a string key is shown below:
data_pt = { key: "GoogleHQ", lat: 37.4220698, lon: -122.086278 };
Using data points results in decreased memory usage as well as a performance increase as there is no need to create Google map markers. See Creating data points vs creating Google map markers
Grid Tiles and Cluster Markers
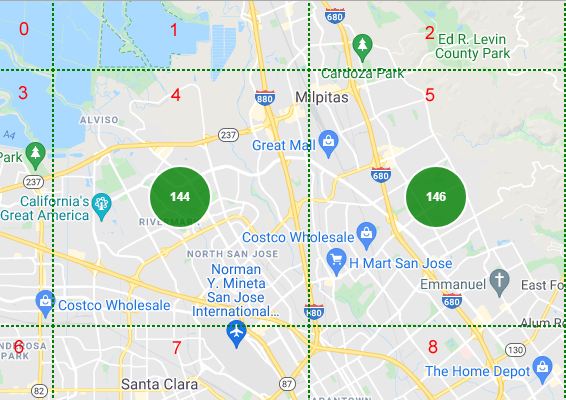
By default, Google maps consist of tiles that are 256 x 256 pixels in size. "Grid tiles" that are visible within the map bounds are "indexed" starting at index 0, which is always located in the top left corner of the map viewport. Index numbers increase as you move left to right in column, then row order (as shown below).
Data points are "clustered" into individual tiles. When the number of data points in a tile exceed a configured minimum, a single "cluster marker" is displayed in the center of the tile. In the following image, two cluster markers are present:
- The tile at index 4 has 144 data points associated with it, as shown in the cluster markers label.
- The tile at index 5 has 146 data points associated with it, as shown in the cluster markers label.

Grid Points and Grid Point Markers
Tiles contain a configurable number of "grid point" rows and columns. When the number of data points in a tile is less than the minimum to show a cluster marker, the data points are organized into grid points. The number of grid points within a tile depends on the tile size and the number of grid point rows and columns set when the clusterer is configured. A "grid point marker" is displayed in the center of each grid point that contains one or more data points.
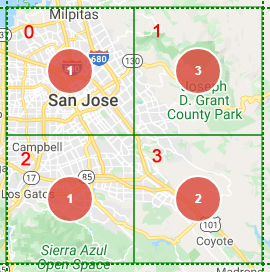
In the example below, the tile size is 256 x 256 pixels and the clusterer was configured to use 2 grid point rows and columns, so each tile will contain 4 grid points.
Grid points within a tile are indexed starting at index 0, which is always the grid point in the top left corner of a tile, moving left to right in column, then row order.
- The grid point at index 0 has one data point associated with it, as shown in the grid point markers label.
- The grid point at index 1 has three data points associated with it, as shown in the grid point markers label.
- The grid point at index 2 has one data point associated with it, as shown in the grid point markers label.
- The grid point at index 3 has two data points associated with it, as shown in the grid point markers label.

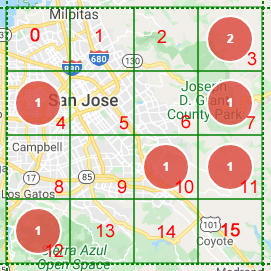
The same tile, using a clusterer configured to use 4 grid point rows and columns has 16 grid points numbered 0 to 15, as shown below:

* Note that grid point borders are not displayed by the clusterer, but were included in the images above for illustration purposes.
See the example of tiles and grid points.